MOONLAND
Contact联系
Case 03 · AntV (Ant Group) · Visualization design system · 2019–2021案例 03 · AntV(蚂蚁集团)· 可视化设计体系 · 2019–2021

Turning chart design
from taste into rules.

把图表设计从审美判断
变成可推导的规则

AntV is Ant Group's open-source visualization family (G2, G6, F2 and friends), built on the grammar of graphics and used across thousands of internal and external products. As a designer on the AntV team I worked on the part nobody could see in a mockup: what a chart should do when the data is bigger, the screen is smaller, and the person building it has never studied visualization.AntV 是蚂蚁集团基于图形语法的开源可视化家族(G2、G6、F2 等),被数千个内外部产品使用。作为 AntV 团队的设计师,我负责的是设计稿里看不见的那部分:当数据更多、屏幕更小、而制作图表的人从没学过可视化时,一张图表应该怎么办。

Role角色

Designer, visualization design system & tools可视化设计体系与工具设计师

Scope范围

Responsive chart rules · design principles · workshop · ChartCube响应式图表规则 · 设计原则 · 工作坊 · ChartCube

Shipped as落地形态

Public spec on antv.antgroup.com · engineering rules in DeepInsight · a web toolantv.antgroup.com 公开规范 · DeepInsight 工程规则 · 一款网页工具

Method方法

"Data-attribute-driven design"「数据属性驱动设计」

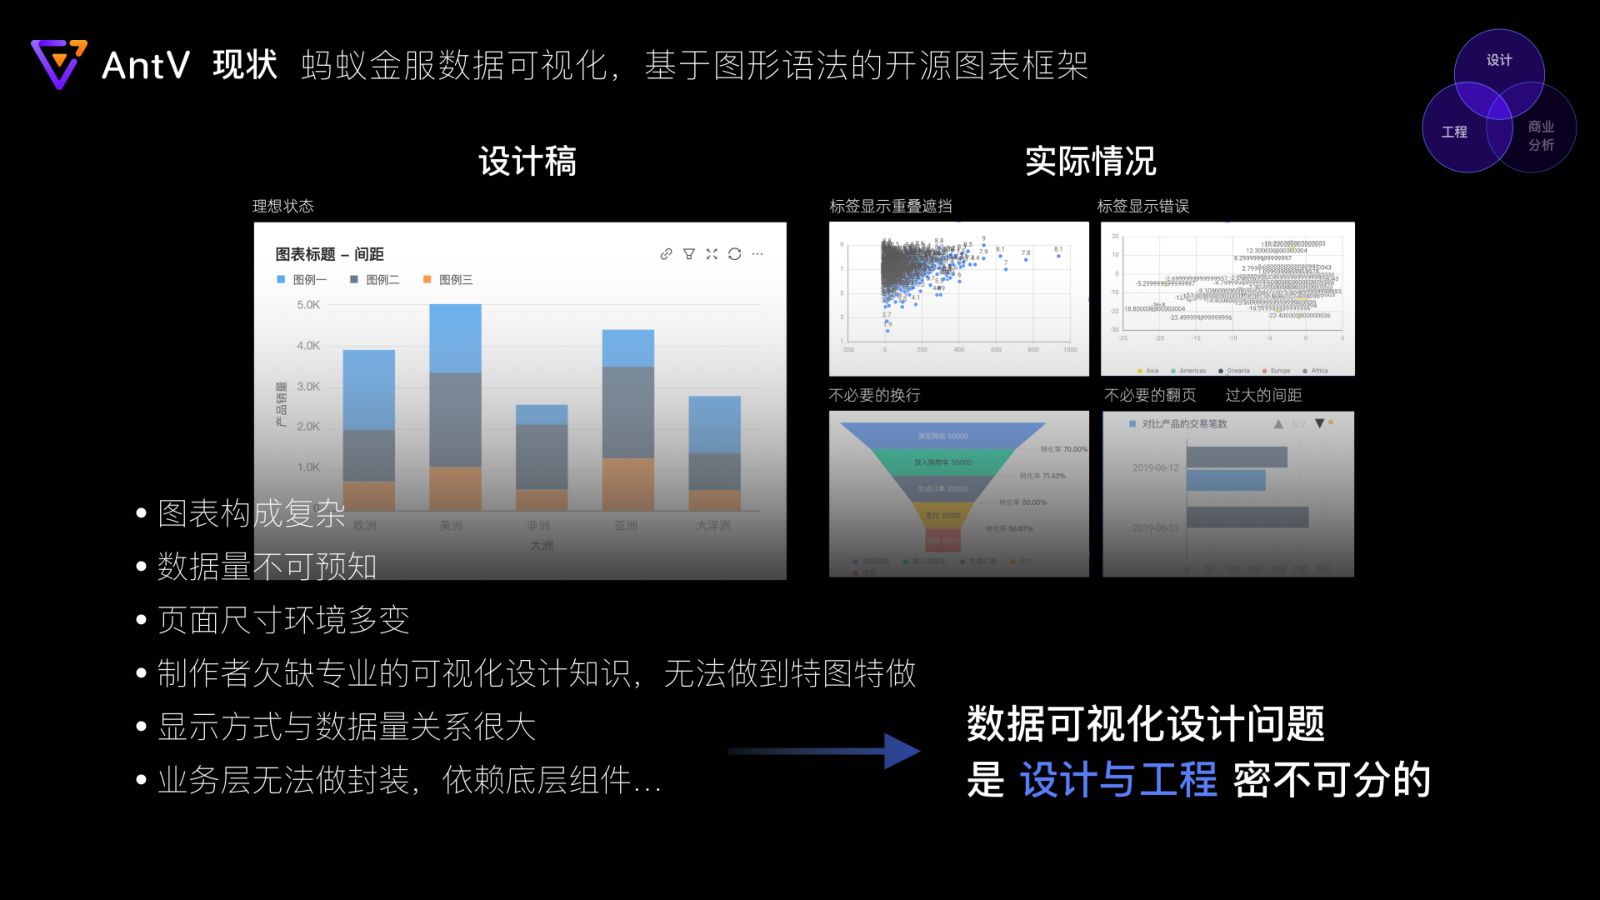
Design mockup vs. reality: overlapping labels, unnecessary wrapping, oversized funnels
Left: the mockup. Right: what happened with real data. Six reasons why, ending in the conclusion that drove everything after: visualization design is inseparable from engineering.左:设计稿。右:灌入真实数据后的情况。六个原因,最后归结为之后一切工作的前提:数据可视化设计与工程密不可分。
The problem问题

"A beautiful mockup becomes a mess the moment unknown data pours in."

「看似美好的设计稿,在灌入未知体量的数据时会变得惨不忍睹。」

Visualization always faces the same conflict: unlimited data, limited screen. Charts are structurally complex, data volume is unpredictable, page sizes vary, and the people wiring up charts are usually engineers without visualization training who cannot modify the underlying component anyway. Designers responded by patching individual cases. That never scales.可视化永远面对同一个冲突:无限的数据,有限的屏幕。图表本身构成复杂,数据体量不可预知,页面尺寸多变,而接图表的人通常是没有可视化训练的工程师,也没法改底层组件。设计师的应对是逐个修补,这永远不可规模化。

The reframe: stop designing charts. Design the rules a chart follows, in a form engineers can implement and non-designers can trust by default.换一个框架:不再设计图表本身,而是设计图表遵循的规则,并且是工程师能实现、非设计师能默认信任的形式。
Two principles that guided every rule指导每一条规则的两个原则

  • MACROCore information first. A line chart must still read as a trend, a bar chart as a ranking, a pie as a share, at any size.核心信息优先。折线图在任何尺寸下都得读出趋势,柱图读出排名,饼图读出占比。
  • MICROWhen space runs out, keep the graphic's character and move details into interaction. Nothing is lost, only deferred.空间不够时,保留图形特征,把细节移到交互里。信息不丢失,只是延后。
Approach方法

From data attributes to layout, deterministically.

从数据属性到布局,可推导地走完

01

Data-attribute-driven design: look at the data before choosing the graphic数据属性驱动设计:先看数据是什么,再决定用什么图形

Statistical attribute × data type → component type → layout strategy. Instead of asking "which chart looks right", the method asks what the data is (categorical, ordinal, numerical, relational, spatial, temporal), how much of it there is, and what the reader is trying to do (compare, see a trend, see a share). The answer to those questions determines the chart, its components, and how each component behaves under pressure. Chart design became derivable and reusable instead of a matter of taste.统计属性 × 数据类型 → 组件类型 → 布局策略。不再问「哪种图表看起来对」,而是问数据是什么(分类、有序、数值、关系、空间、时序)、有多少、读者想做什么(比较、看趋势、看占比)。这些问题的答案决定图表、图表的组件,以及每个组件在压力下的行为。图表设计从审美判断变成了可推导、可复用的规则。

02

Information priority + space strategies = an enumerable set of layouts信息优先级 + 空间策略 = 可枚举的布局集合

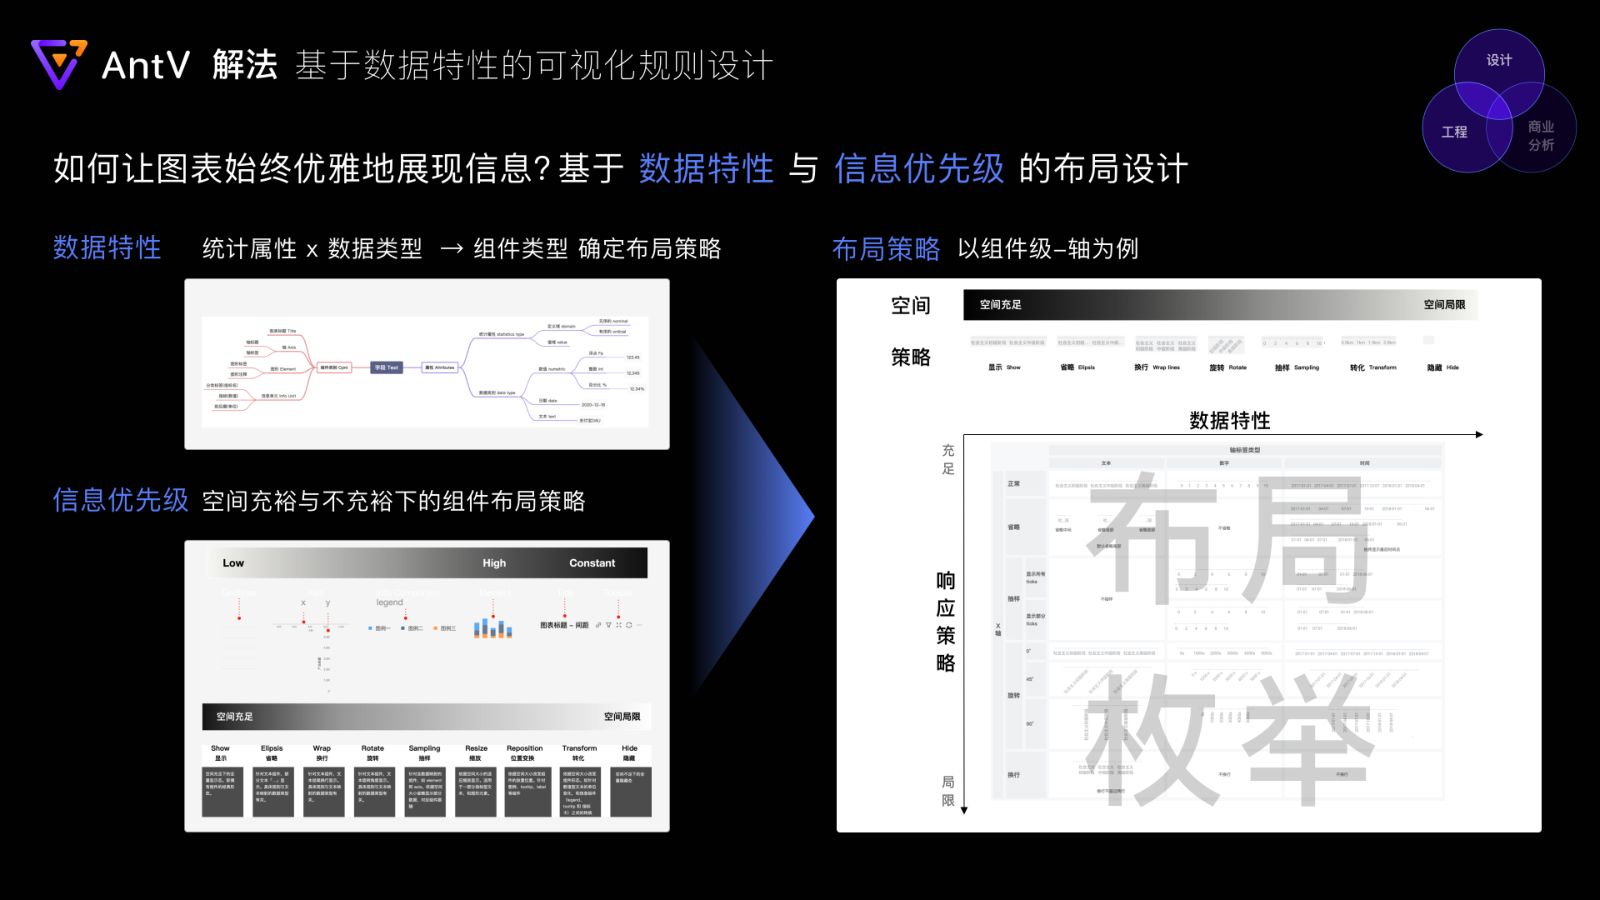
I defined classic layouts at three sizes (PC card ≈560px, mobile ≈350px, mini), decomposed each chart into components (title, toolbar, axes, elements, labels, legend, guidelines), and ranked every component as Low / High / Constant. Then, for space-sufficient and space-scarce cases, each component got a strategy: show, ellipsis, wrap, rotate, sample, resize, reposition, transform, hide. Crossing priorities with strategies produced a finite matrix of layouts per chart. That matrix is the deliverable, not a picture.我在三种尺寸(PC 卡片约 560px、移动端约 350px、迷你)下定义经典布局,把每张图表拆成组件(标题、工具栏、坐标轴、图形、标签、图例、辅助线),再给每个组件定 Low / High / Constant 三级优先级。然后在空间充裕与不足两种情况下,为每个组件指定策略:显示、省略、换行、旋转、抽样、缩放、重定位、转化、隐藏。优先级与策略交叉,得到每类图表有限的布局矩阵。交付物是这张矩阵,而不是一张图。

Data traits and information priority produce enumerated layouts
03

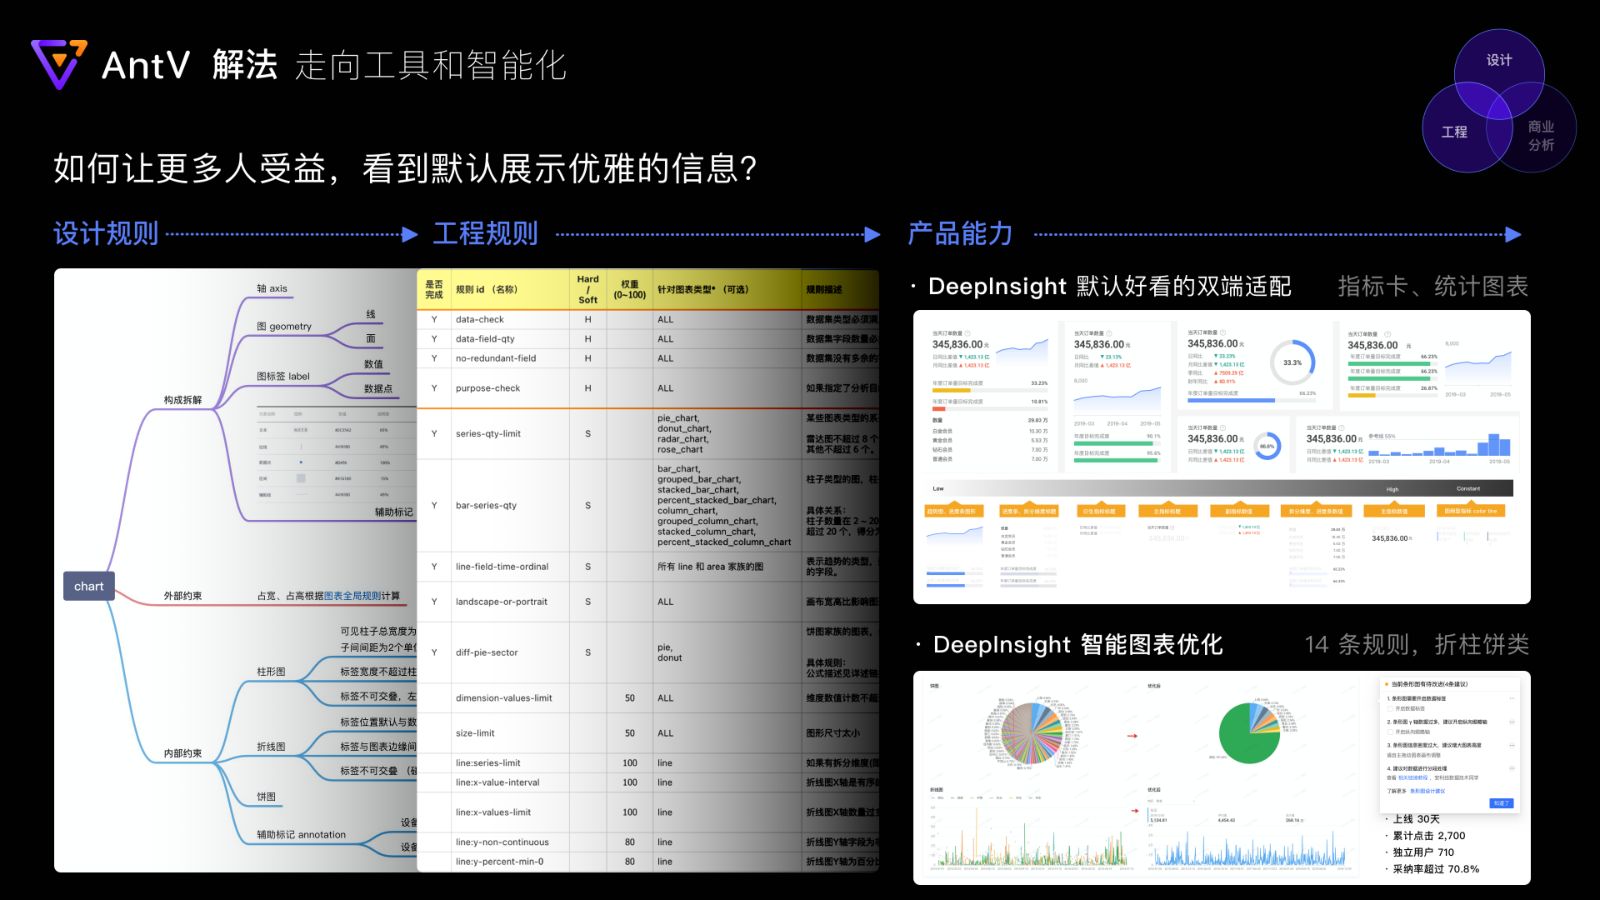
Design rules → engineering rules → a product capability设计规则 → 工程规则 → 产品能力

Every design rule was rewritten as an engineering rule with an id, a hard/soft flag, a weight and the chart types it applies to (data-check, no-redundant-field, series-qty-limit, bar-series-qty, dimension-values-limit, line-x-value-interval and so on). Those rules shipped inside DeepInsight as "good-looking by default" charts on PC and mobile, and as a smart chart-optimization feature with 14 rules for pie, bar and line charts.每条设计规则都被改写成工程规则:有 id、硬/软标记、权重和适用的图表类型(data-check、no-redundant-field、series-qty-limit、bar-series-qty、dimension-values-limit、line-x-value-interval 等)。这些规则在 DeepInsight 里落成 PC 与移动端「默认好看」的图表,以及一个针对饼图、柱图、折线图的 14 条规则智能图表优化功能。

Design rules become engineering rules and a product capability
04

The public specification and the workshop公开规范与可视化工作坊

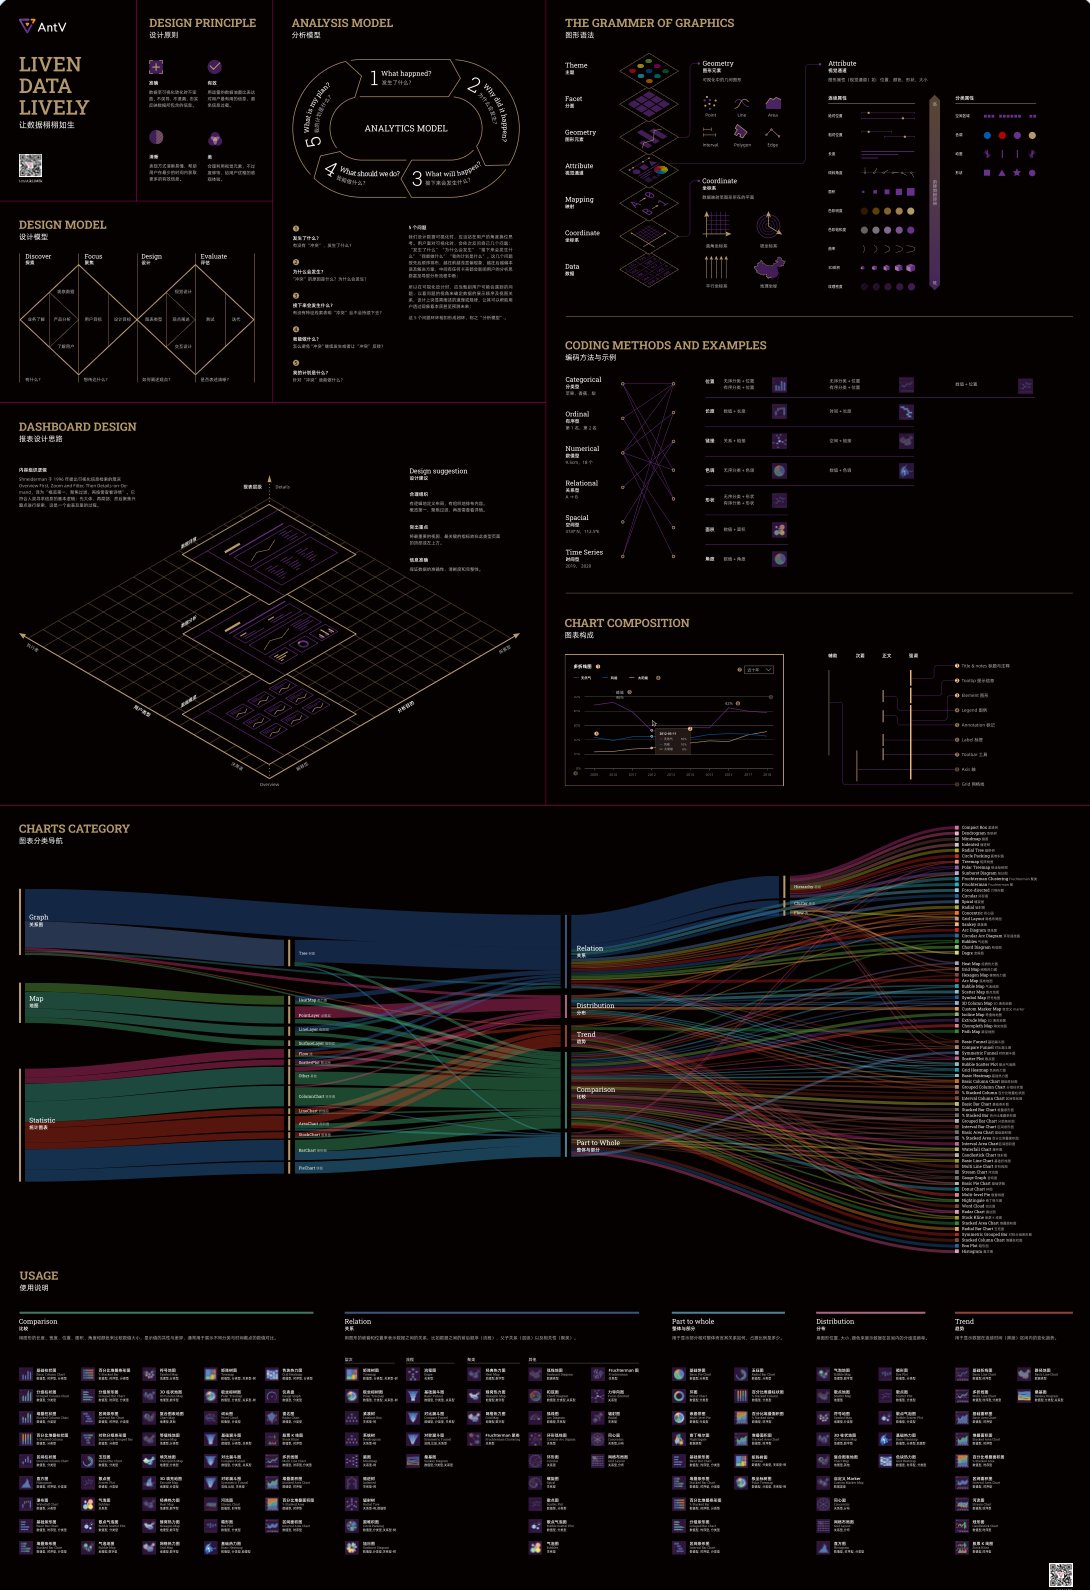
The rules were published as part of the AntV design language, where I authored the responsive (multi-device) section and contributed to the chart, dashboard and mobile guidelines. I also ran the internal visualization workshop and designed its poster, "Liven Data Lively": design model, analysis model, grammar of graphics, encoding methods, chart composition and a sankey of every chart family, so that engineers and PMs could reason about charts with the same vocabulary designers use.这些规则作为 AntV 设计语言的一部分公开发布,我撰写了其中的响应式(多端媒介)章节,并参与统计图表、看板与移动端指引。我还主持了内部可视化工作坊并设计了海报「Liven Data Lively」:设计模型、分析模型、图形语法、编码方法、图表构成,以及一张覆盖所有图表大类的桑基图,让工程师和产品经理能用设计师的词汇讨论图表。

Liven Data Lively workshop poster

Public pages I authored or co-authored我撰写或参与撰写的公开页面

The AntV values I worked under were "accurate, clear, effective, beautiful"; they later matured into "trust, ease, meaning", which is the better name for what the rules were always trying to protect.我参与时 AntV 的价值观是「准确、清晰、有效、美」,后来演进为「信任感、轻松感、意义感」。后者其实更准确地说出了这些规则一直在保护的东西。

05

ChartCube: the rules as a tool anyone can useChartCube:把规则变成任何人都能用的工具

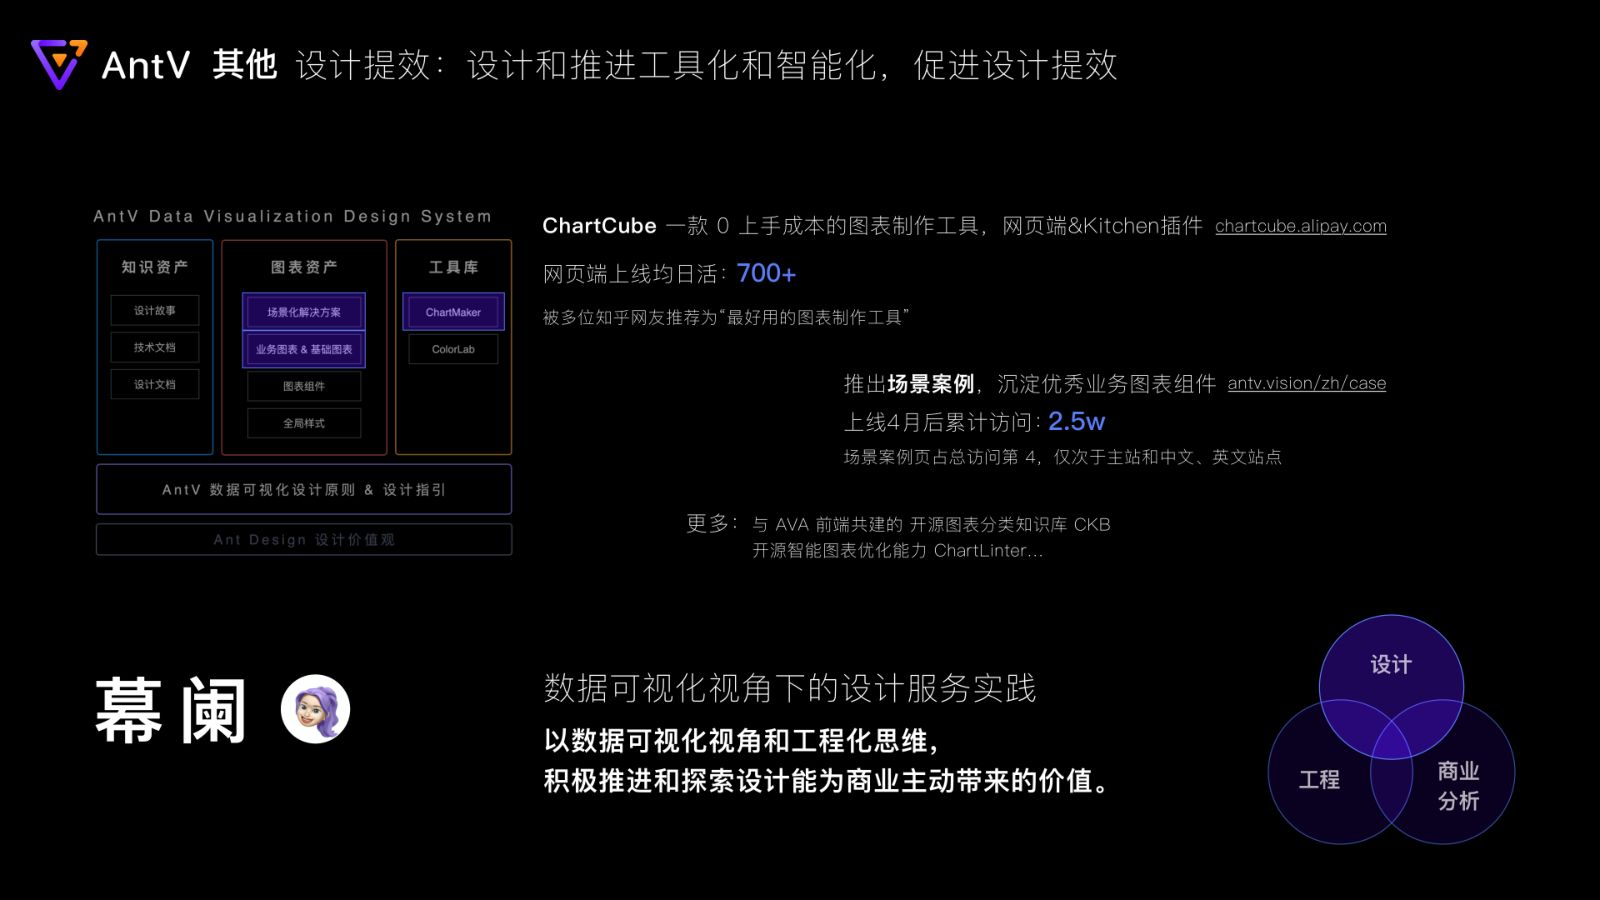
Rules are only useful if people meet them without reading them. ChartCube (图表魔方) is a zero-learning-cost chart maker: paste data, get a well-formed chart that already follows the spec, export as image, code or a Kitchen/Sketch plugin artifact. I led the design and prototyping of ChartCube and the Kitchen chart tool, and shaped the scenario-case library that shows real business charts done right.规则只有在人们不用读也能遵守时才有用。ChartCube(图表魔方)是一款零上手成本的图表制作工具:贴入数据,得到一张已经符合规范的图表,可导出为图片、代码或 Kitchen/Sketch 插件产物。我主导了 ChartCube 与 Kitchen 图表工具的设计与原型,并参与规划了展示真实业务图表正确做法的场景案例库。

AntV design system, ChartCube and scenario cases
Outcome结果

Rules that people met without reading them.

人们不用读也能遵守的规则

14
Rules in DeepInsight's smart chart optimizationDeepInsight 智能图表优化的规则数
70.8%
Adoption rate of suggested optimizations in the first 30 days (2,700 clicks, 710 users)上线 30 天优化建议采纳率(2,700 次点击,710 位独立用户)
700+
Daily active users of ChartCube on the webChartCube 网页端日活
25k
Visits to the scenario-case library in four months, the site's 4th most visited page场景案例库上线四个月访问量,站内访问第 4 的页面

What I took with me: the habit of asking "what is the data" before "what should it look like", and the conviction that a design system for tools is only real once it runs as code. Both show up again in how I write skills for coding agents today.我带走的东西:先问「数据是什么」再问「它该长什么样」的习惯,以及一个信念:工具类的设计体系只有跑成代码才算真的存在。这两点在我今天为 coding agent 写 skill 的方式里又出现了。

Next case下一个案例 HappySeeds — say a vibe, get a playable app →HappySeeds——说出一个想法,长成一个可玩的应用 →